

Case Study - Matri & the NHL
This case study focuses on my research process through Matri’s engagement with the NHL.
Matri x
NHL
Matri, Inc., was hired by an NHL team (the “Team”) to create a 3D data visualization tool enabling both technical and non-technical stakeholders to better harness data in player acquisition decision making. As Matri’s sole UX researcher and product designer, I designed and conducted all user research.
Note: Due to NDA, this case study includes adapted content.
Helpful Definitions:
(Optional Reading)
Glyph

A glyph is an organization of geometries, where each geometry represents a data parameter. The image above is a glyph representing a major league baseball player, where each ring, sphere, and cylinder represents a different data parameter.
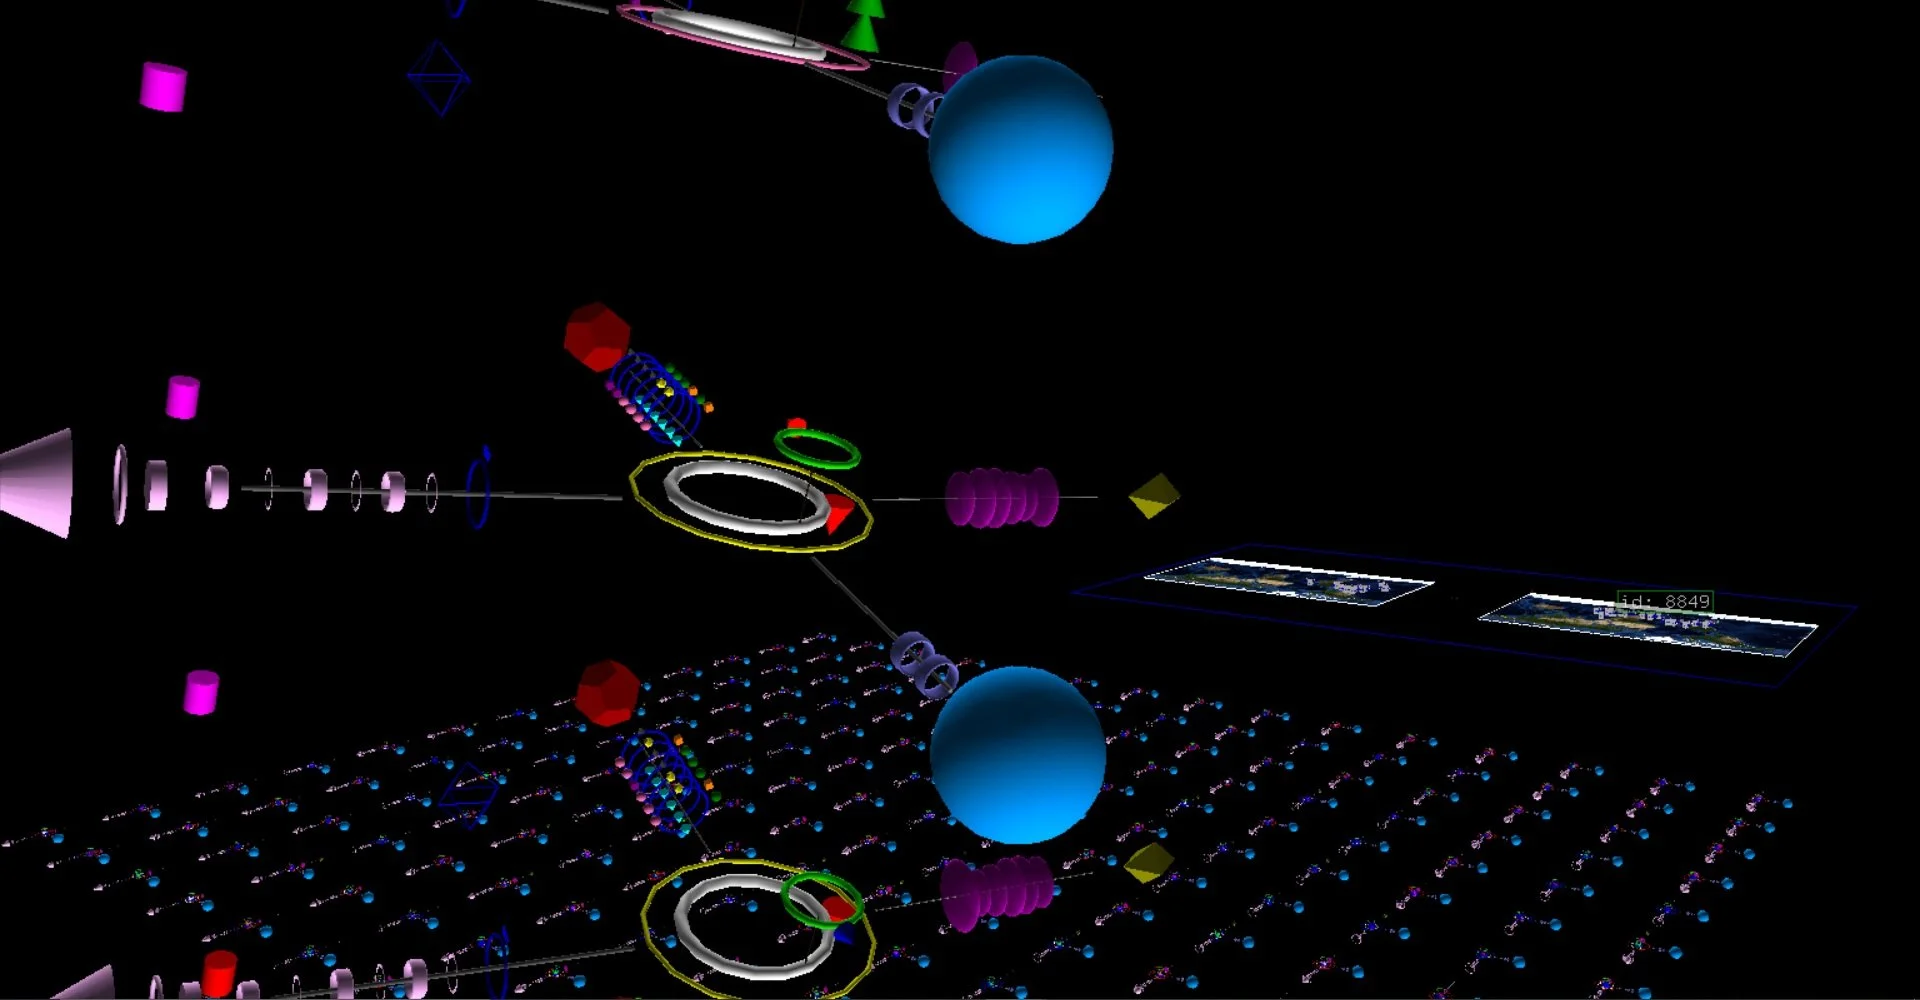
Visualization
At Matri, visualizations (or “viz” for short) encompass a collection of glyphs arranged in 3D space. As a product designer, my goal is to arrange glyphs in 3D space to help users find relationships among their data. In this viz gif, we see 30 of the glyphs from our previous example.
Visualization Scene
A visualization scene describes a collection of multiple related visualizations in the same screen view - kind of like a dashboard. Viz scenes tell a deeper story, affording both high-level and detailed glimpses of relevant data. This example shows 4 unique visualizations within the same scene.
The Product
Matri’s core technology is a 3D data visualization software leveraging cognitive psychology and visual perception principles to help users find relationships in large swaths of data very quickly. For our NHL contract, our goals were two-fold:
Design and deploy custom 3D data visualizations,
Integrate these visualizations into the Team’s in-development software, which I’ll call “TeamCONNECT” for purposes of this portfolio.
My Role:
All tasks involved in end-to-end primary research such as:
Research Planning: including identifying research goals, choosing research methods, creating a research plan,
Conducting Mixed-Method Research, and
Analyzing and synthesizing results
Planning
The most crucial part of my research process is the planning—creating research goals, understanding business needs, and assessing existing insights. This section provides a vignette on how I set research goals.
Identifying Research Goals:
To identify my research goals, I ask the following questions:
What do I want to know?
What don’t I know?
How will I know when I’ve learned it?
How will this support business goals?
Those questions led to the following research goals:
To gain in-depth understanding of how NHL Team stakeholders currently use data in their player acquisition decision-making processes and what pain points they face.
To determine how our visualizations could best be deployed to enhance those decision-making processes while adding as little friction to stakeholder workflows as possible.
Methods
Interviews:
The Tasks:
Designed an interview protocol.
Conducted over 30 hours of in-depth user interviews with Team stakeholders.
The “Why”:
to gain insights into each user’s role in the process and how they integrate data,
to determine stakeholder’s modes and patterns of thinking,
to glean pain points, attitudes, and behaviors,
to develop trust and inter-personal relationships.
*modes and patterns of thinking as defined in Minhea Moldoveanu’s 2011 paper “Transcendental Pragmatism and Adaptive Intelligence: Sources and Foundations for Integrative Thinking”
Field Studies
The “Why”:
to directly observe player acquisition decision making as a system across departments,
to study how stakeholders actually use data vs. how they describe their data usage, and
to gain insights from realistic user behavior in realistic contexts.
The Tasks:
Spent 2 weeks conducting field studies of the Team’s draft meetings.
This leaned into ethnographic research—outside of meetings, I went to Team dinners and events.
Contextual Inquiries:
The Tasks:
Observed 20+ weekly intradepartmental meetings, instructing the meeting’s facilitator to describe routine meeting processes as they occurred.
The “Why”:
to promote accurate information gathering as to how our product would be used by each specific user group,
to gather honest insights and attitudes.
Synthesis Process
To translate my findings from data into actionable design solutions, I generate various research assets. Below, I’ll illustrate some of these assets through the lens of the Amateur Scouting user persona, Brock.
Empathy Maps
Through empathy maps, I quickly saw a consistent pain point emerge—deep frustration between those stakeholders who work with data versus those who did not. To bridge this divide, I concluded that Matri would need to positively and proactively address concerns revolving around data, showing the value of data without devaluing observational-based methods.


Affinity Mapping
I created affinity maps in Mural to build user groups, then develop user personas.
User Personas
User personas revealed the disparity between users’ actual data needs versus the data they received. It also uncovered that users were being flooded with data inputs—so they tended to ignore it. This greatly influenced my design principles, which you’ll see later on.
Brock’s Journey Map
During the journey mapping phase for Brock, I noted the amount of time scouts spend with little-to-no internet access—on planes, in international hockey arenas, etc. As such, offline usability became an important feature.
Design Principles
After all the synthesis, I devised the following principles to guide design for Matri’s data visualizations:
Design must be simple, yet impactful for adoption to take place.
Design must demonstrate empathy and address long unmet user needs to combat resistance.
Offline usability and mobile adaptability were integral.
We must increase visibility of the data sources available to stakeholders.
Experiences must be targeted to user group and decision-making scenario.
Our team needed to stick to strategic messaging in communications with the Team to get non-technical stakeholders onboard.
Our product’s design must afford accessible navigation through 3D digital spaces.

An image of my puppy, Billie Jean, helping me through early iterations of storyboards. Everybody needs a research assistant.
UX Research Deliverables:
I provided the Team with the following research deliverables:
-
This comprised of a summary of the data collected and synthesized insights gleaned from my study. In my research reports, I like to truly empathize with my audience to keep them engaged - so you know there were plenty of hockey metaphors in there.
-
An abridged version of my research report in slide format, which I presented to the Team's Ownership.
-
In the data map, I provided the Team with an overall view of the data sources available for visualization purposes. At the start of our contract, communication struggles between Team departments prevented a clear understanding of the types of data available to different stakeholders. Through my research with Analytics stakeholders, I was able map that out.
-
I provided the Team with in-depth journey maps - one covering the NHL draft and one covering the entire NHL season. These journey maps were brought to Development Camp in the fall so stakeholders could see how one another contributed to the player acquisition picture, thereby building empathy.
To our internal product team, I provided:
-
From my research, I generated principles for our Matri internal team to promote user-centered design and delivery of our visualization product.
-
Through interviews, I was able to glean initial functional and non-functional technical requirements, as well as some technical constraints. Later in the design process, our lead data scientist and a software engineers delved deeper into these.
-
After interviewing the Team's GM, AGM, and ownership stakeholders, I was able to glean expectations on project timeline and scope, Ownership and management goals, and stakeholder expectations.
Results:

Matri’s product launched eventually launched successfully with the Team. The outcomes were significant:
30% increase overall in data-driven decision-making.
60% increase in scouting data usage.
100% adoption among Executive Amateur Scouts.
To learn more about how we achieved these results, visit my NHL Product Design case study.

Next Up: Design
To learn how this research impacted the design of our 3D visualizations for the Team, scroll down and click the option for the next page. To see the UI I designed for this contract, see the previous case study.