
Matri x NHL:
Scoring Big with Data-Driven Decisions

Box Score: The Final Solution
I designed an intuitive user interface for proprietary 3D data visualizations, driving impactful player acquisition insights for an NHL team.

Key Stats:
A Hat Trick of Success

+30% increase in team-wide data-driven decision-making
+60% surge in scouting data usage
100% adoption among Executive Amateur Scouts
The Faceoff:
🏒 Tackling the challenge
Following several seasons of underwhelming performance, the Team sought to gain a competitive edge by integrating data earlier into player acquisition workflows. However, different stakeholders had vastly different data needs and levels of engagement. The challenge was clear: design an intuitive data visualization tool that democratizes data insights across user groups to improve draft and trade decisions.
Process Insights
The Highlight Reel
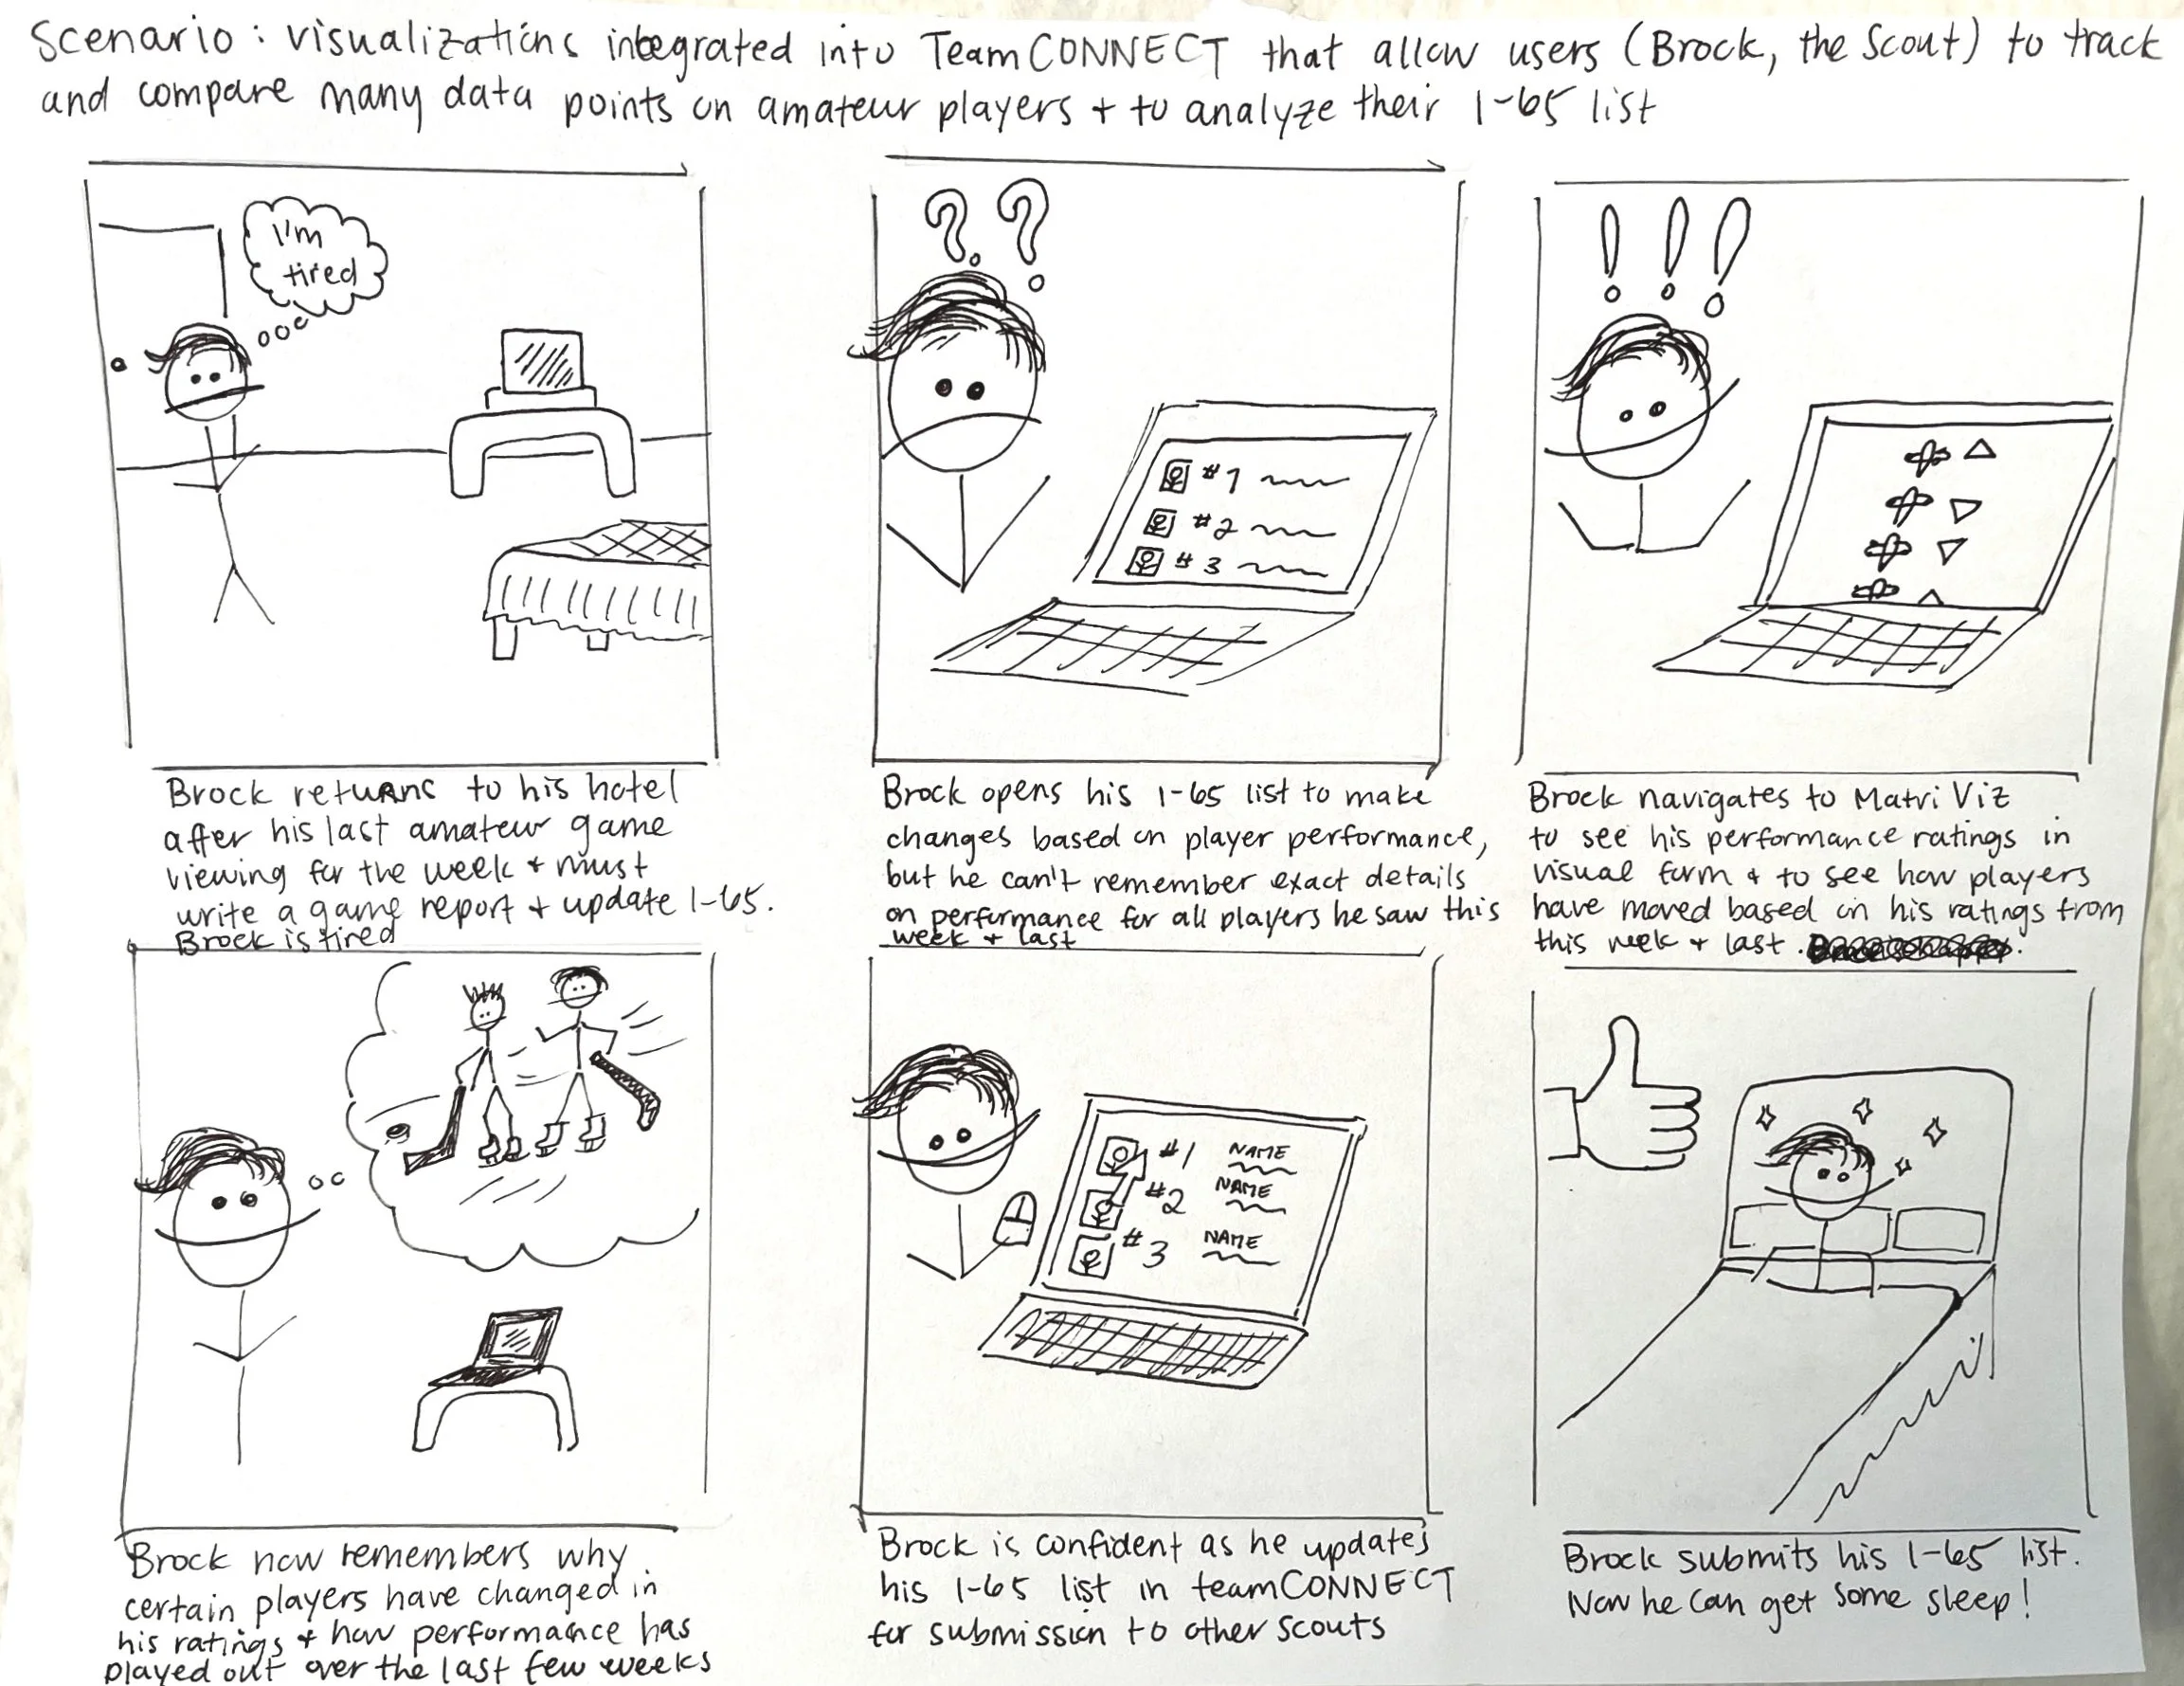
One of the tools I used to advocate for the data needs of scouts: storyboards.
Empathize:
To assess needs and identify gaps in player acquisition workflows, I conducted 30+ interviews and 2 weeks of field studies with the team. This research revealed an underemphasis on the data needs of scouts—despite their heightened role in player acquisition. To make data more approachable to scouts, we first needed to understand their perspective.

An affinity map I created in Mural to sort users into groups, identify key data needs, and build user personas.
Define:
I developed user personas and mapped out the decision-making processes and cognitive workflows of each. By identifying each persona's unique modes of thinking—whether intuition-driven or analytically grounded—I prevented internal Matri biases from dictating which data was considered important, ensuring equitable access to data.

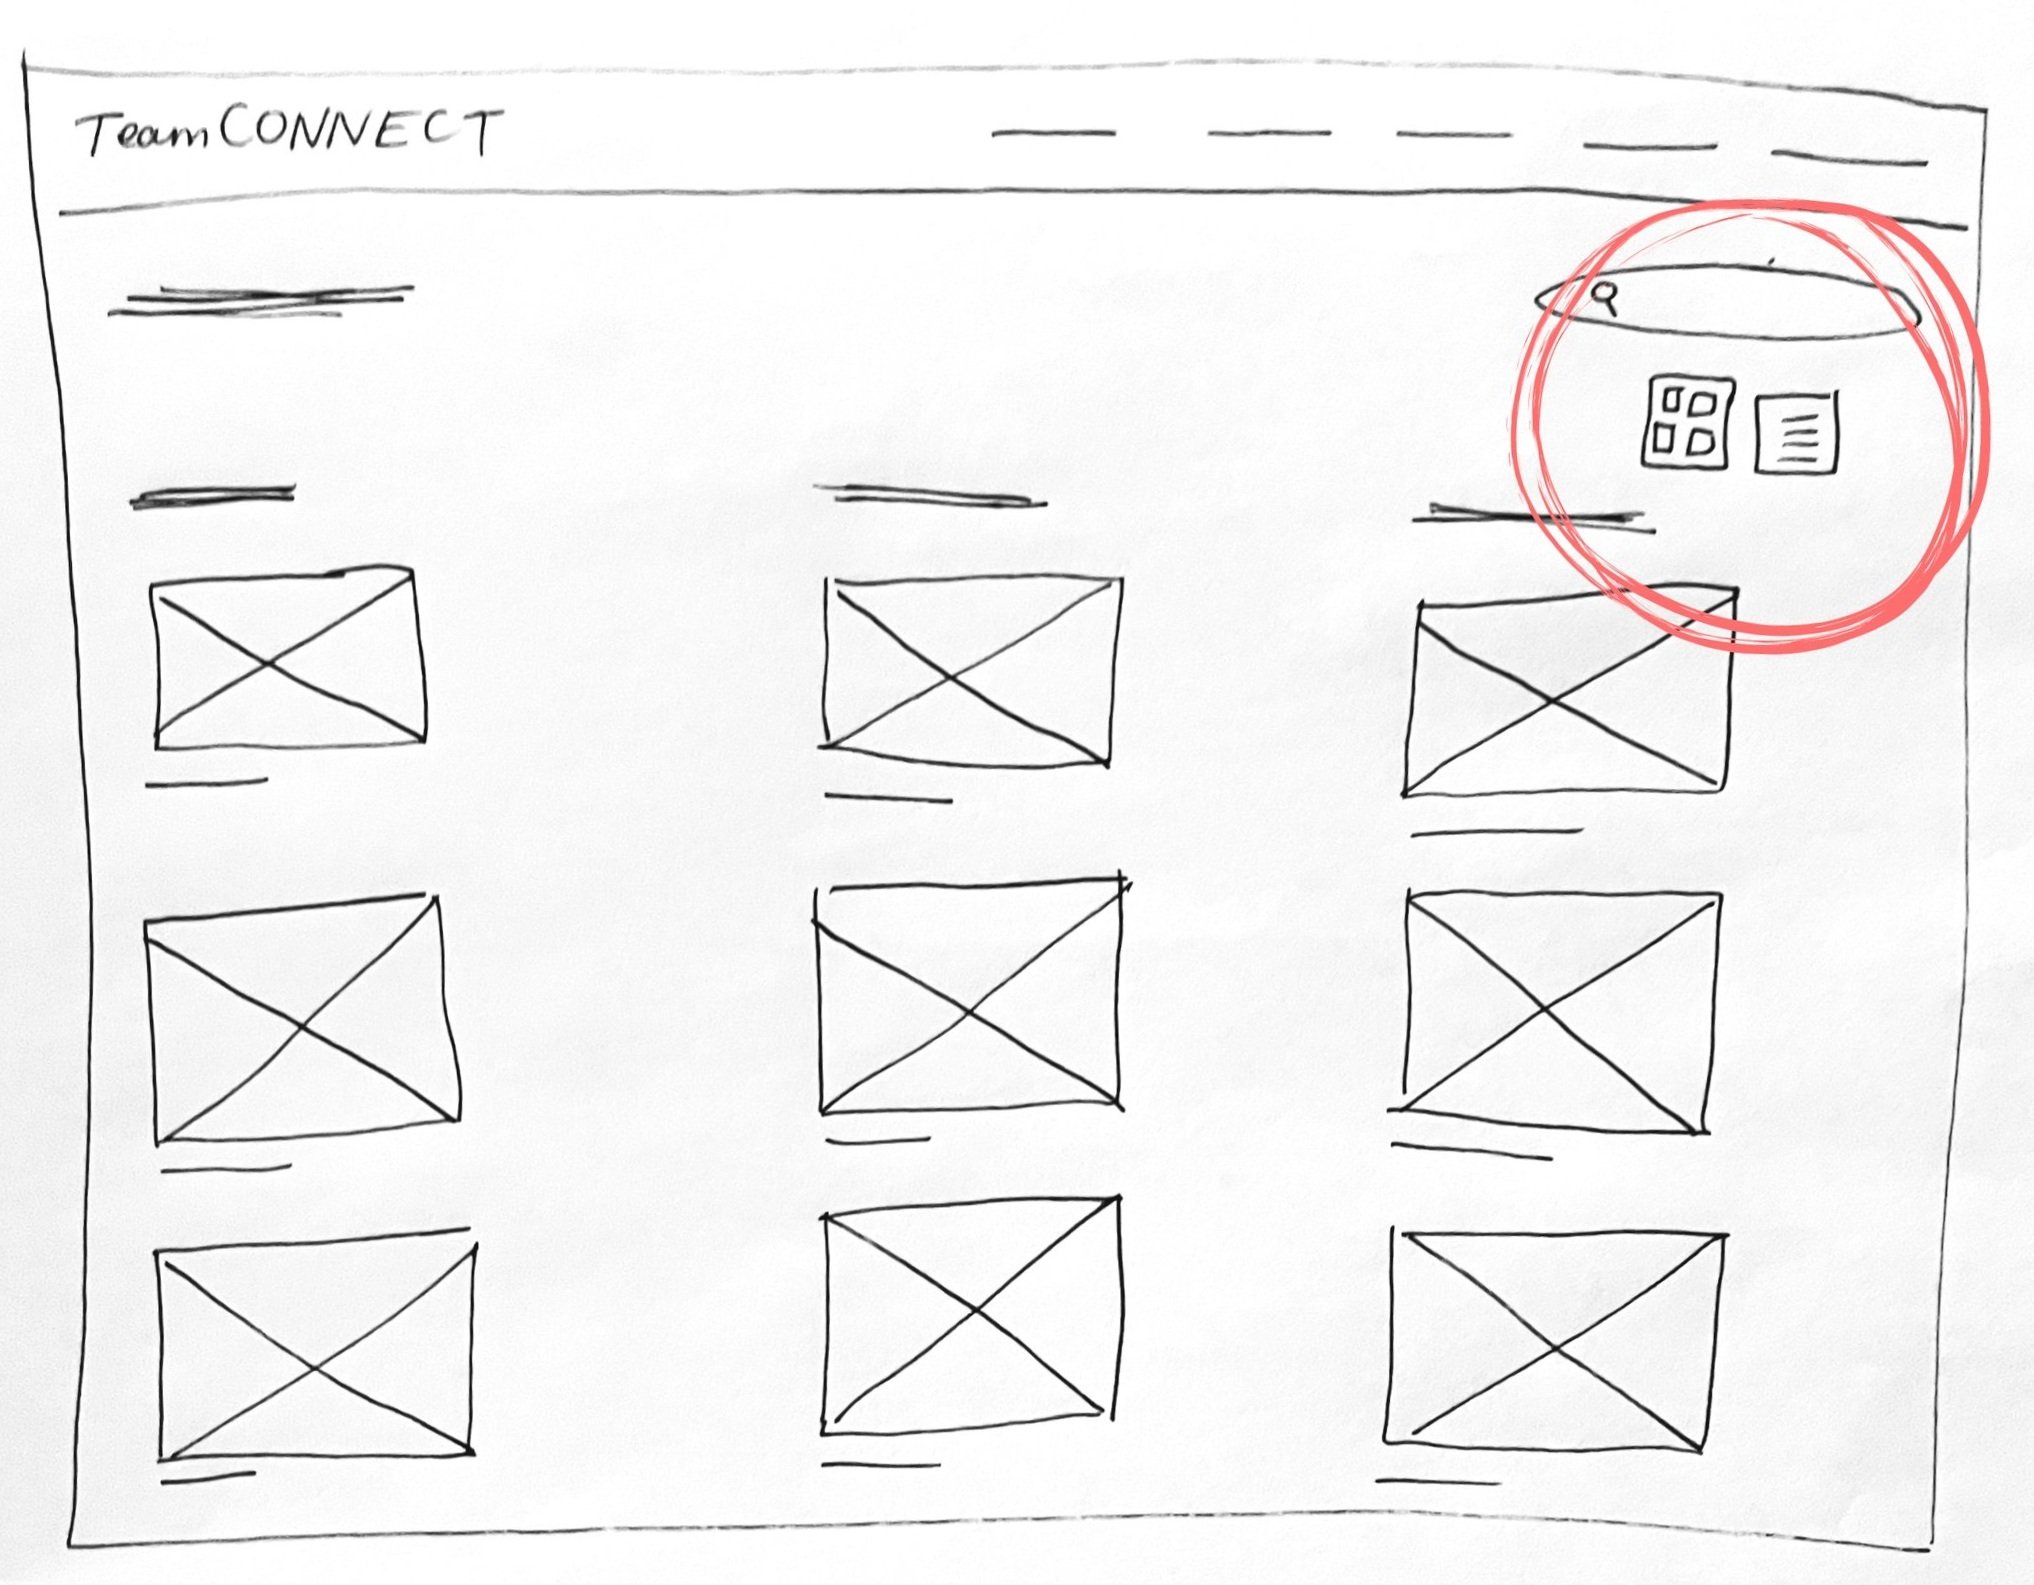
Early wireframes for the NHL product.
Ideate & Prototype:
Throughout the design process, I collaborated cross-functionally to brainstorm solutions, prioritizing equitable design by ensuring prototypes addressed the diverse user needs. I rapidly created and tested prototypes with end-users, tailoring iterations to varying technical skill levels and cognitive workflows, ensuring intuitive interactions and accessibility.
Power Plays:
Key Design Decisions

Simplified Navigation
for diverse users
Designed a sidebar navigation for desktop and a robust suggested visualizations section for mobile to ensure intuitive access to key insights.
Streamlined user flows for scouts by addressing their specific pain points, reducing friction and improving task efficiency.

Prioritized Core Features
Eliminated unnecessary elements, such as gallery toggles and thumbnails, to focus on critical functionalities that directly supported user goals.
Prioritizing these features not only saved time and development resources but also reduced cognitive load for users.

Realigned
Visualization Viewer
Leveraged cognitive load theory to make the visualization viewer the focal point of the UI, reducing distractions and enhancing usability for diverse technical skill levels.

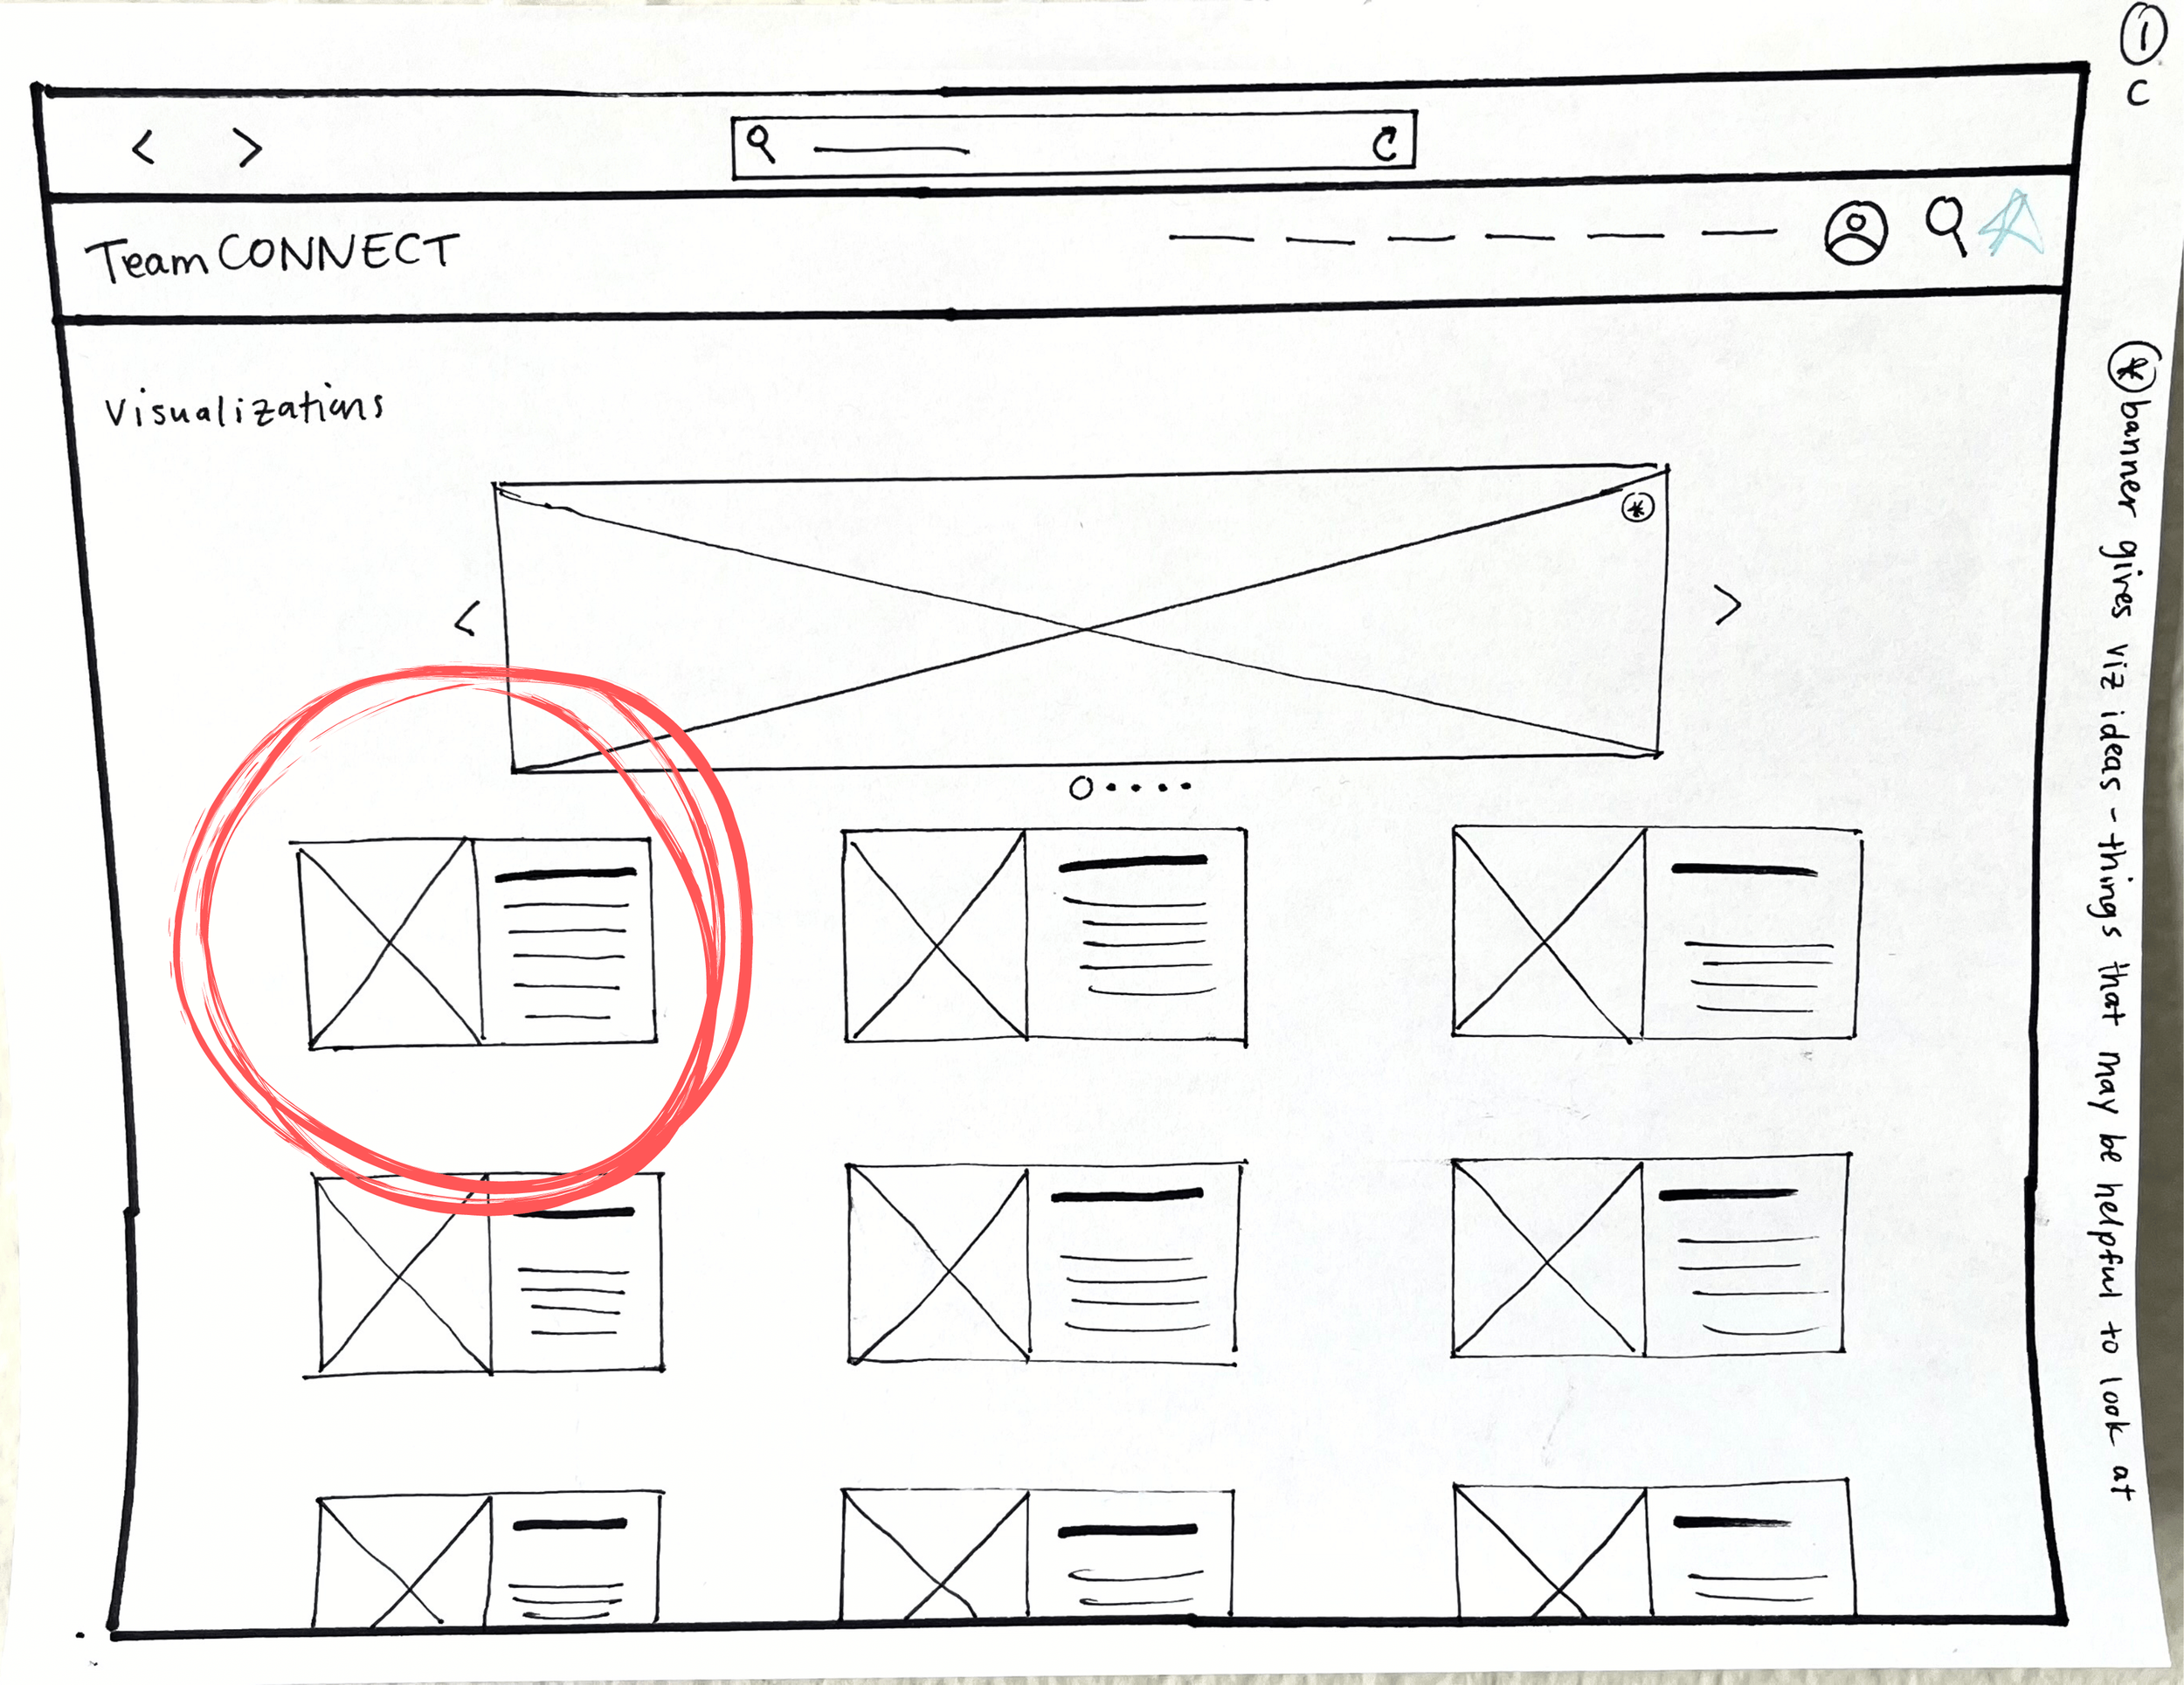
Before - a wireframe of the viz browse page with the viz viewer to the right

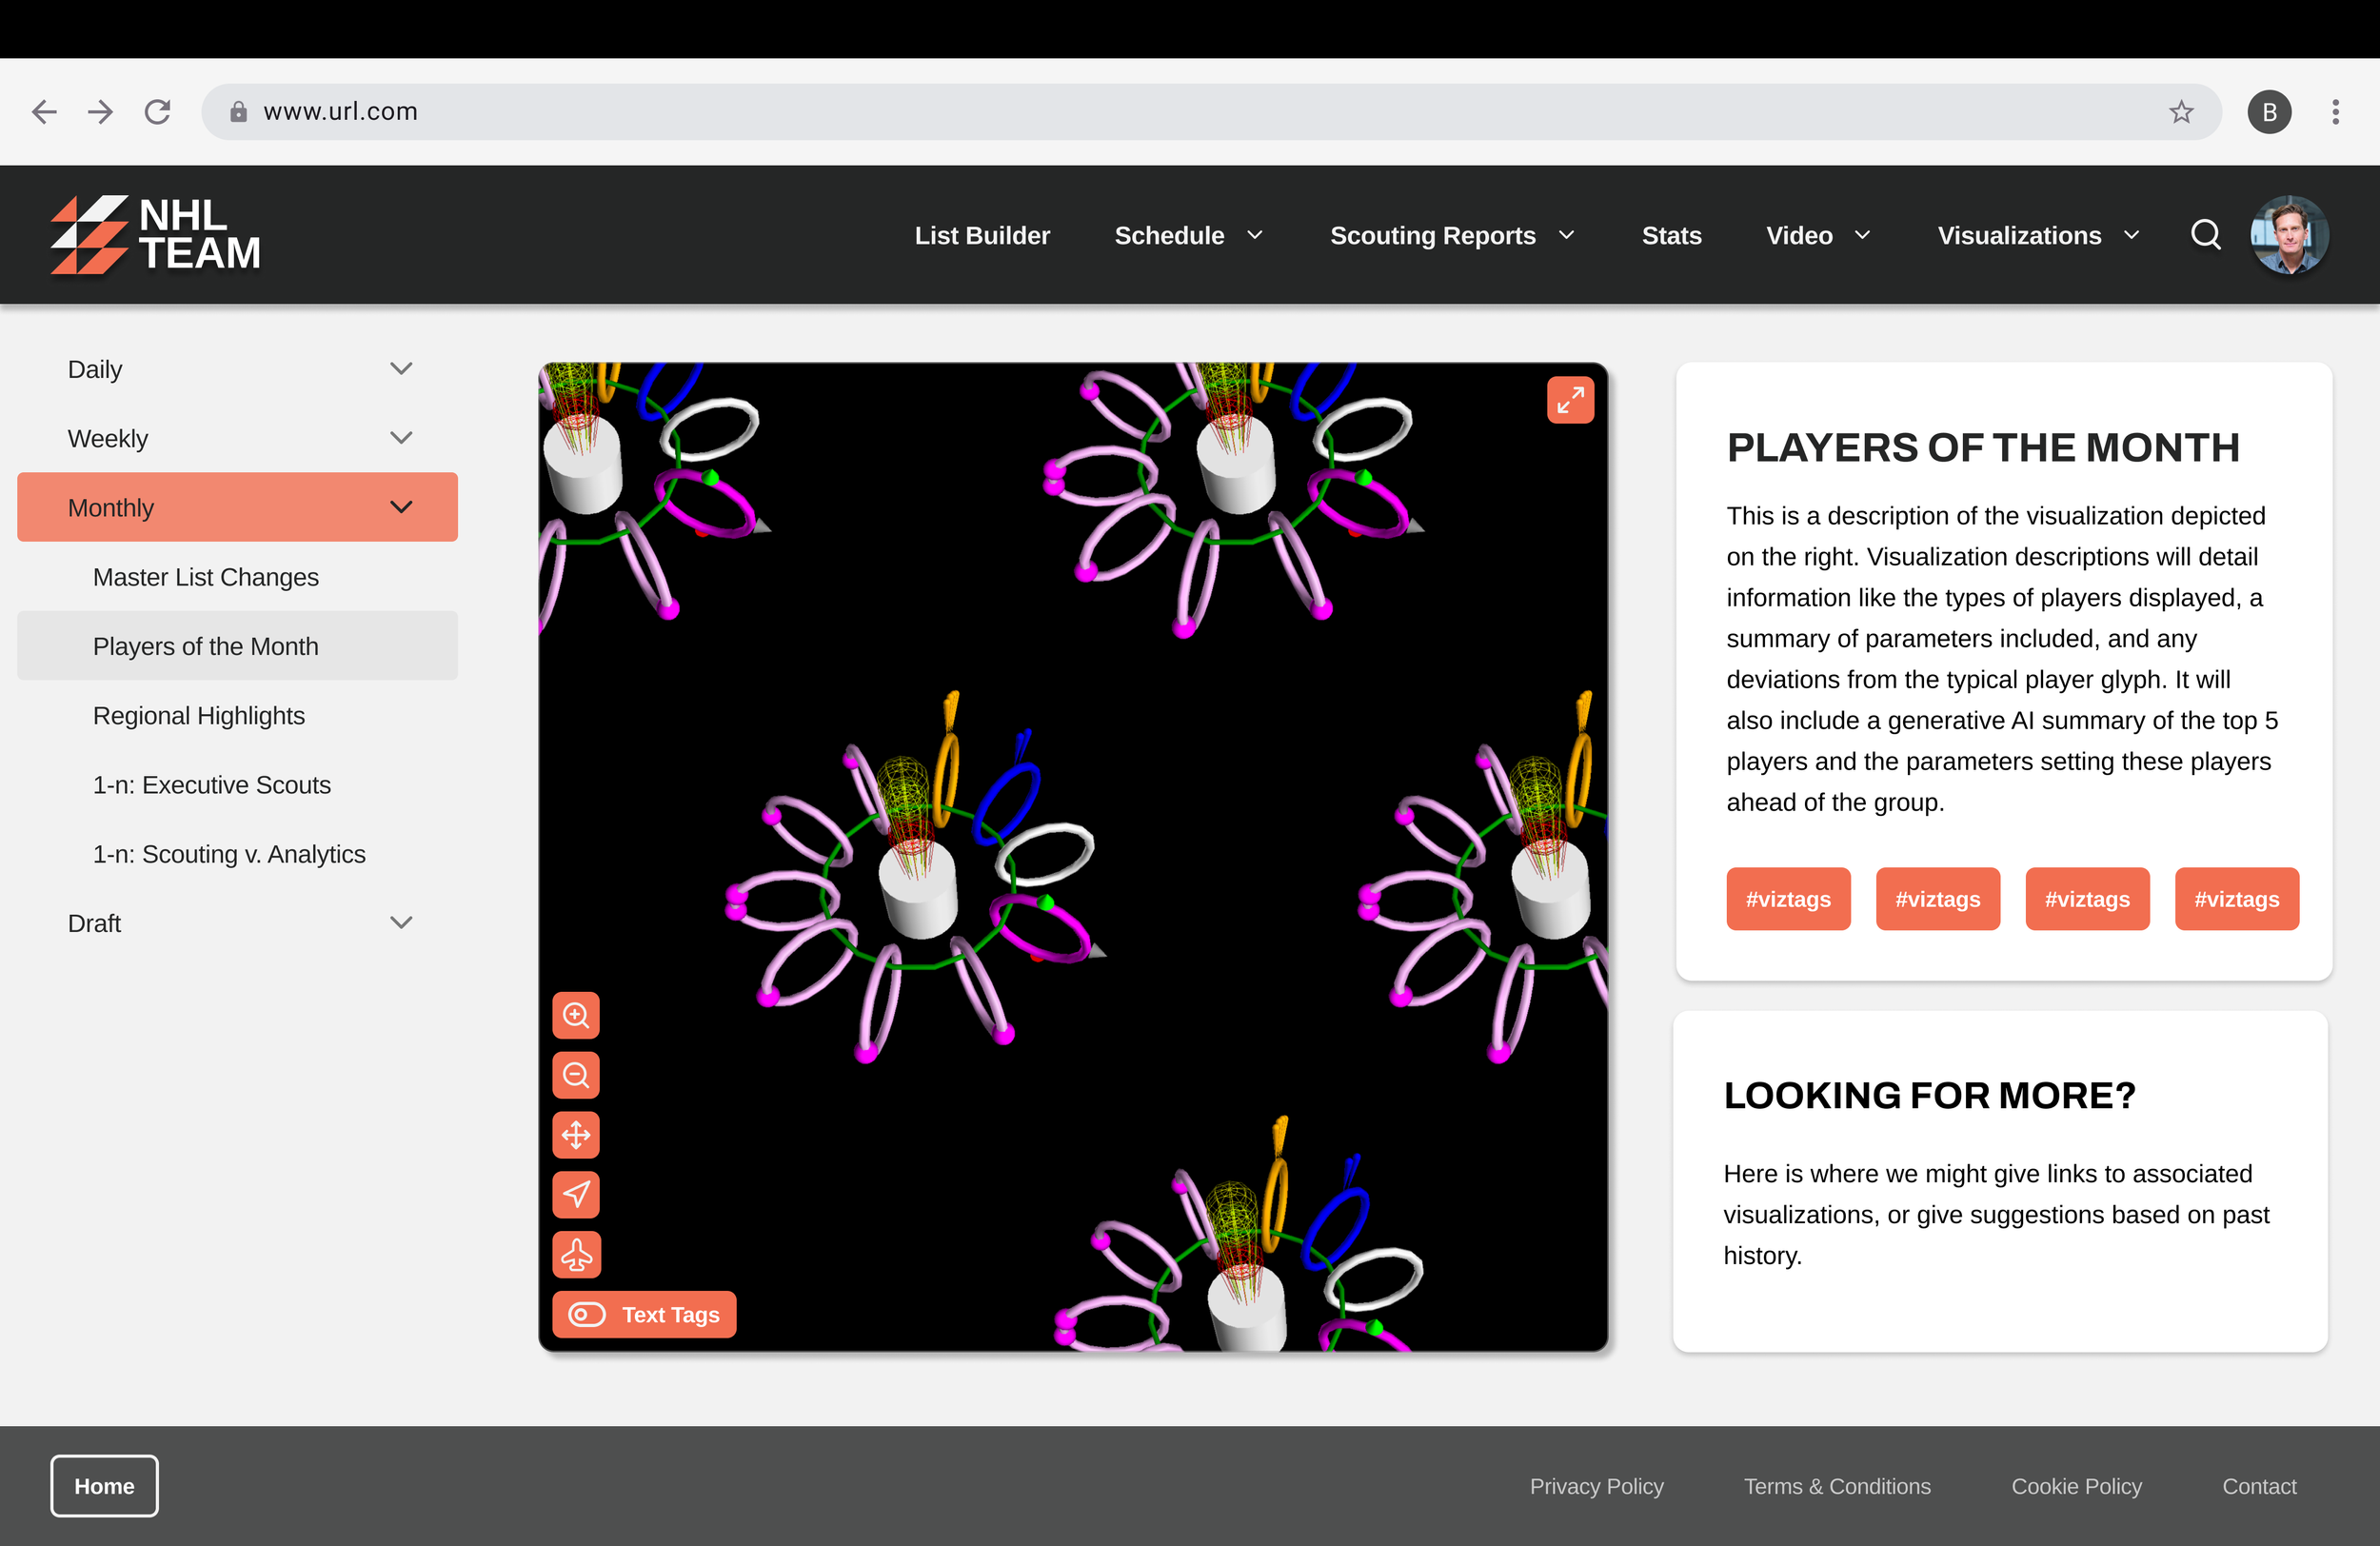
After - a mockup of the viz browse page with the viz viewer centered

The “W”:
Impact
The product launched in November 2021, empowering scouts, coaches, and management to leverage data more effectively:
+30% in overall data-driven decisions across the team.
+60% boost in scouting data usage, overcoming initial resistance.
100% adoption by Executive Amateur Scouts, who reported improved workflows and increased efficiency.
High fidelity prototype of the viz viewer expanding

Post-Game Analysis:
LESSONS LEARNED

Human-Centered Design Iteration: Iterative user testing revealed gaps in initial assumptions about user workflows, reinforcing the importance of continuous validation in design.

Ethical Design Advocacy: Challenging assumptions was key to prioritizing user needs over institutional bias. Mapping decision-making processes and advocating for diverse cognition ensured equitable insights and trust.

Stakeholder Engagement: Using storyboards, user personas, and journey maps demonstrated the value of storytelling in unifying diverse teams around user needs.
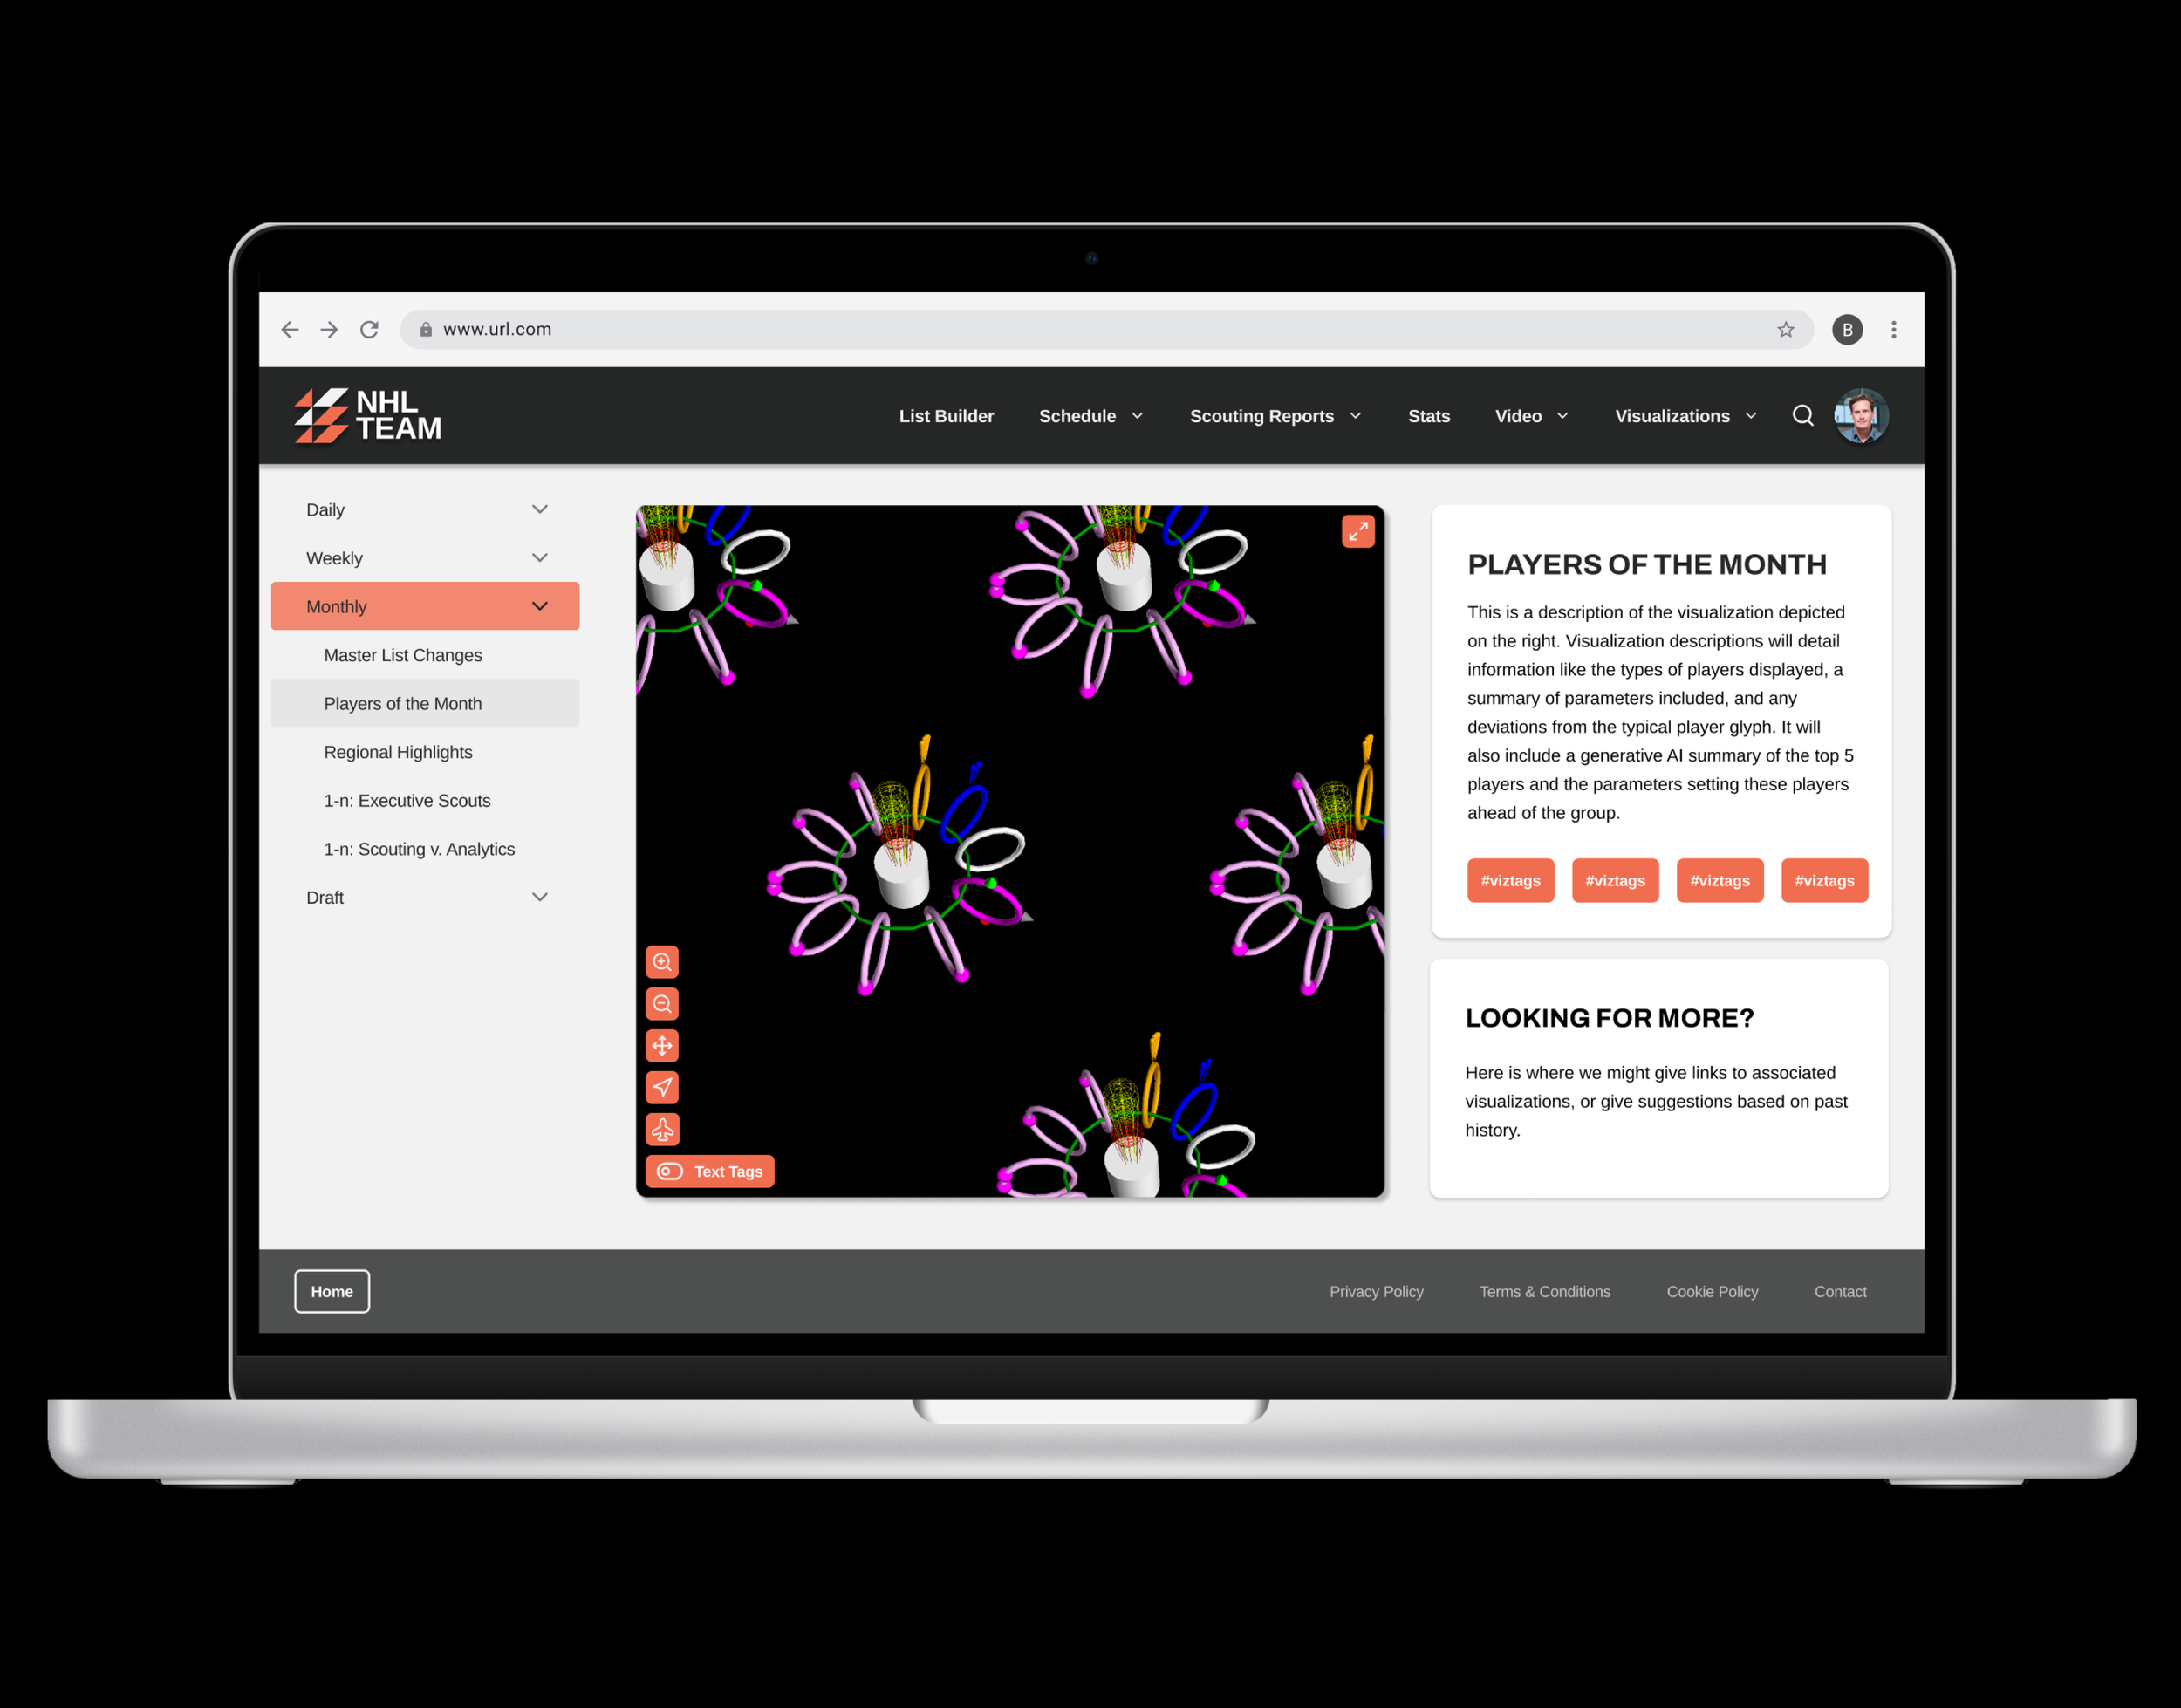
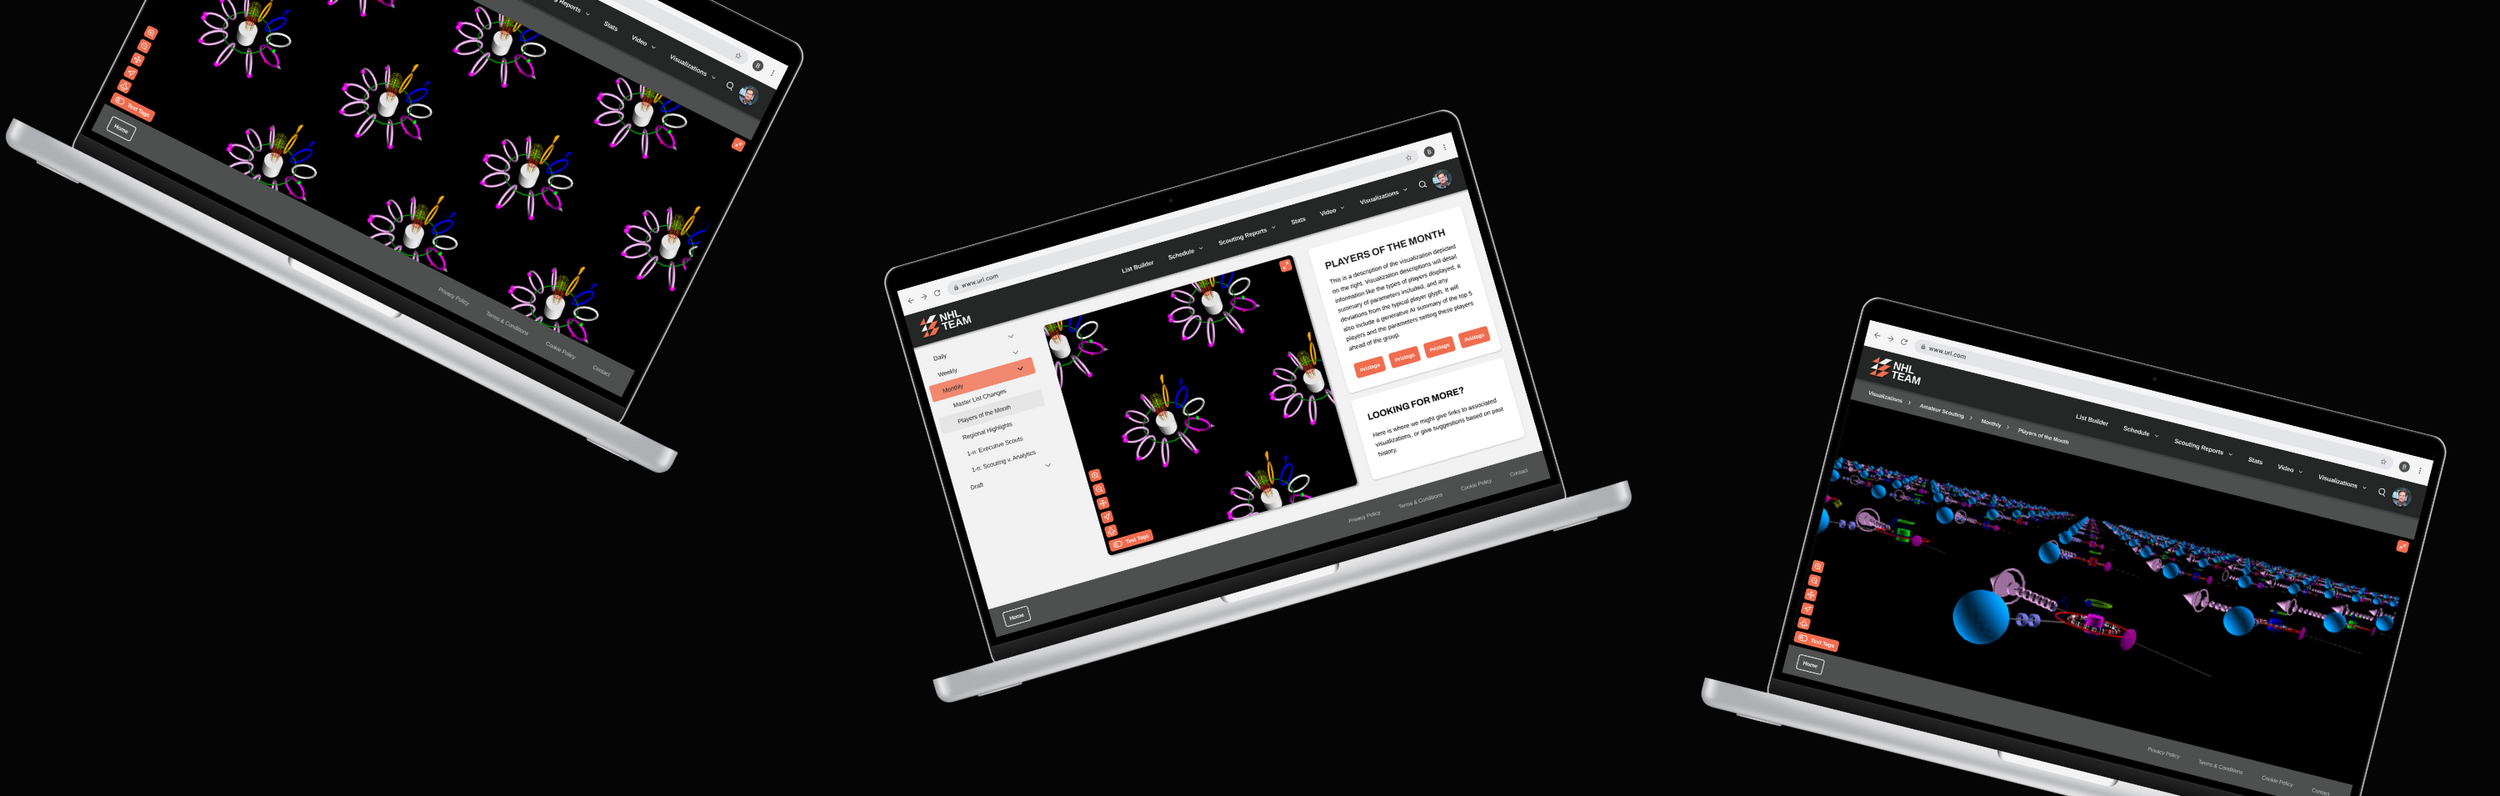
Page within the UI allowing users to browse different data visualizations

Visualization viewing window expanded to show more of the data
The Next Play:
Explore More
Want to see more of my design work? Scroll down to navigate over to my next case study.
Feel free to reach out here to discuss all things design!