

wear.matri
wear.matri is a 3D visualization product for users of wearable technologies. Matri’s 3D data visualization software leverages the natural neural processes of human perceptual experience to enable a more efficient mechanism for identifying patterns and relationships in data.
Product Overview
wear.matri started as an idea by the company’s CEO - a former Navy Officer and current fitness enthusiast - to analyze her own health data. During my tenure at Matri, I led the product’s design through the beta testing phase. The beta product was a subscription service emailing users a series of data visualizations designed to explore sleep, readiness, and workout data.
The product’s goal was to be a simple, effective means of helping users make meaning of their wearable data to improve their health. By turning user’s health information into actionable insights, we hypothesized that users could make more data-informed decisions about their health and wellness.
After my time at the company, Matri launched the product. wear.matri currently comprises 18 different visualizations emailed to customers on a daily or weekly basis.
My Role:
On this project, I acted as both the UX Researcher and Designer from inception through the product’s beta test. Keep scrolling to dive into more detail!

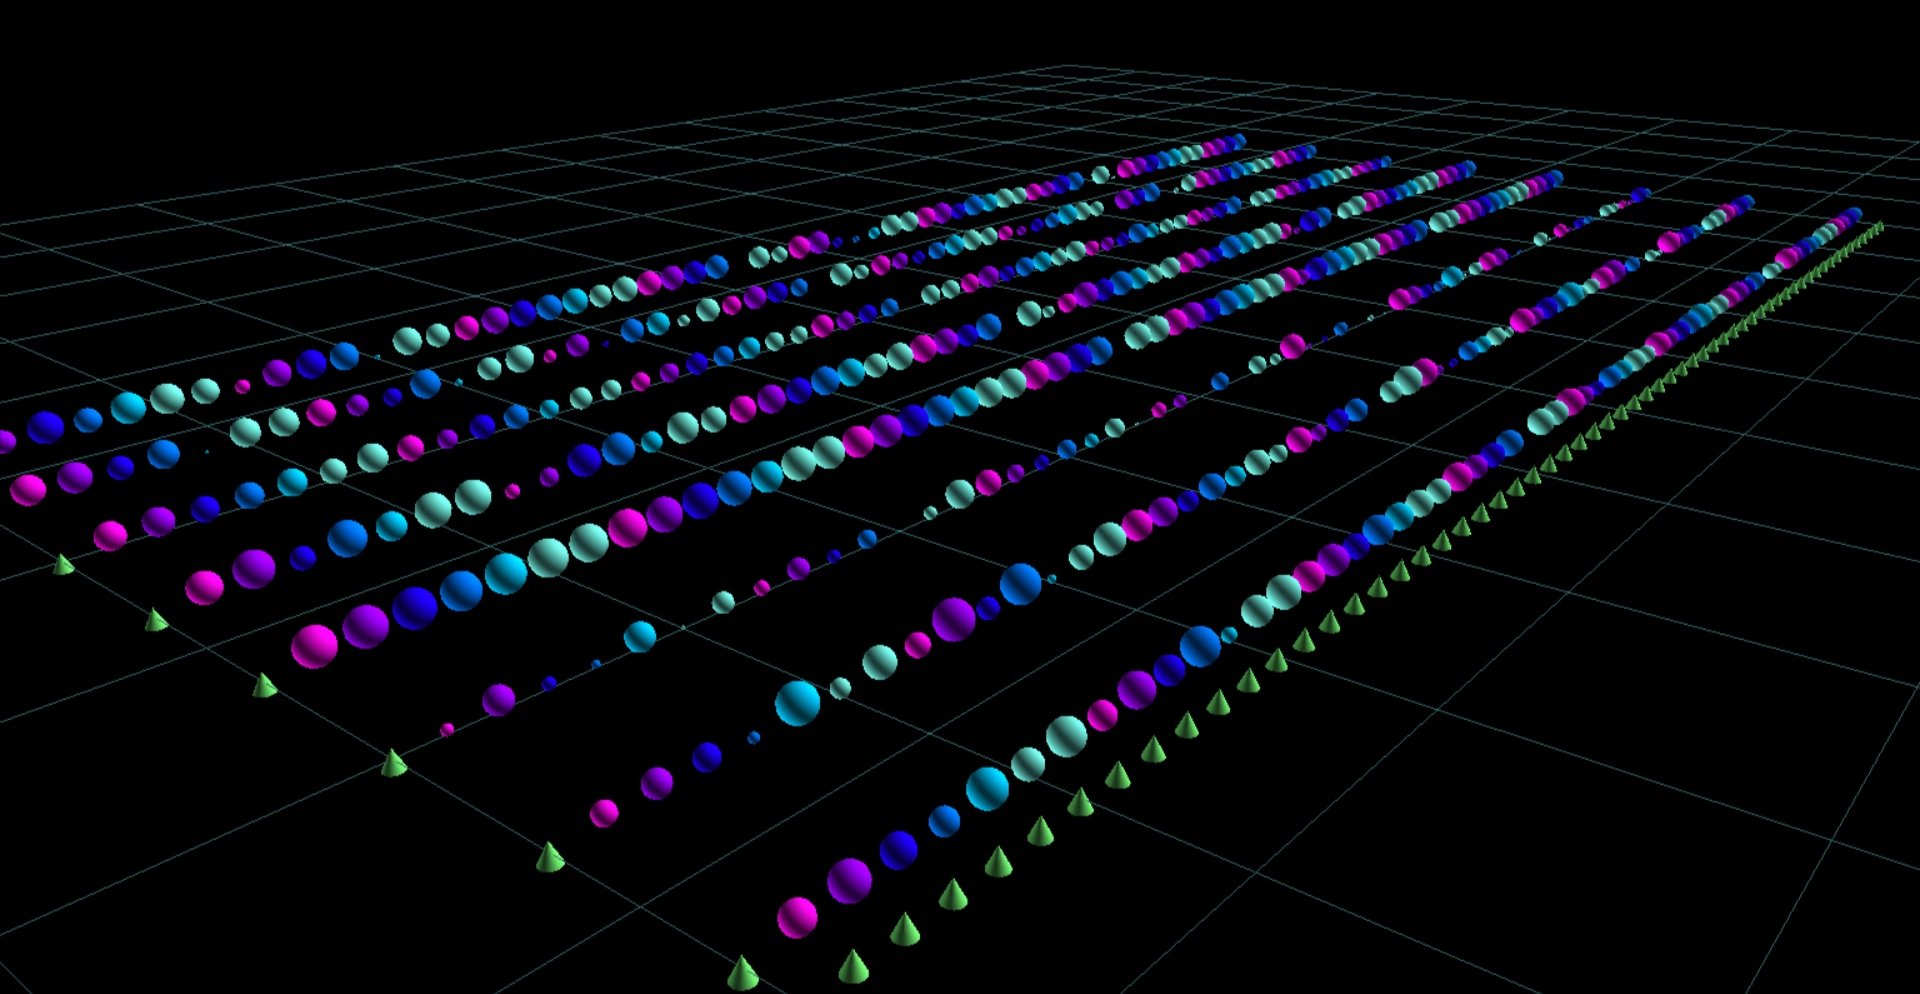
An exploratory data analysis visualization for wear.matri parameters overlaid with a user persona I developed for the product.
UX Research
For user research, we recruited employee friends and family who are veterans, active duty military, professional athletes, recreational athletes, fitness enthusiasts, and individuals looking to get more active. We wanted to better understand what performance data our potential users would find useful and which wearable(s) they wore. I conducted research through a series of interviews & surveys. From here, I generated user personas and journey maps. Additionally, I conducted secondary research on common wearables' APIs to determine what data these devices collect. Armed with the available data and my user research, I defined key categories for parameters that aligned with our users’ goals - these were Sleep, Readiness, and Workout.
UX Design
The design phase started with paper ideation. Knowing we wanted each glyph - a collection of geometries representing related parameters - to display a day’s worth of wearable data, I explored dozens of different ways to visually organize the data. After testing with members of the Matri team who use wearables, I moved into quick, lo-fi prototypes. Below are examples of my paper ideation and lo-fi prototypes created in the open source 3D visualization software, ANTz.

A simplified glyph, showing 3 parameters represented by rings. The color of the sphere on each ring (ranging from red to green) indicate standard deviation of each parameter as relating to the rest of the month.
This design relied on the mental model of a clock for users to analyze their sleep data. Sphere colors represent light sleep (light blue), rem sleep (pink), deep sleep (dark blue), and brief wake periods (lilac).
Quick drawings for brainstorming with the team in the paper ideation phase.

wear.matri web design
As Matri, Inc. is a small startup (10 employees), all employees wore multiple hats. In addition to user research and visualization design, I also designed the wear.matri website. This was a unique design opportunity for me as I was solely responsible for designing and building out the site on Squarespace. The free reign to ideate and execute design - from wireframes to launching the site, from site copy to wear.matri branding - was unparalleled. The screen capture below shows a high-fidelity prototype of the site design.
The main goals of the website were as follows:
To inform potential users about the product, company, and beta test
To allow users to sign up for the beta test.
To allow users to sign up to purchase the product before launch.
Results:
The beta test was a success, with roughly 100 participants from Matri employee networks subscribing to the product as a result. From this beta test, we learned which glyph designs and parameter combinations worked best for making meaning of wearable data. For example, designs that leveraged mental models - like a clock - were most popular. In addition, complex designs - like the flower glyph - made it more difficult for users to perceive differences in data.
This beta test had a significant impact on the final design of the product, which was launched after my tenure at Matri.
